The visual spectrum
Pass sunlight through a triangular prism or bounce it off the finely grooved surface of a compact audio disk and see it break merrily into a band of pure sparkling color, its "spectrum," familiar in the colors of a rainbow, in light glittering from newly fallen snow, in the rings and haloes around a partly- clouded Sun and Moon, in the flash of a cut diamond, and in so many other facets of nature. The classic colors red, orange, yellow, green, blue, and violet connect in a seemingly infinite number of shades, one blending smoothly into the next. Together they constitute the "visual spectrum" (or "optical spectrum") because it is the part of the full spectrum that is seen with the human eye.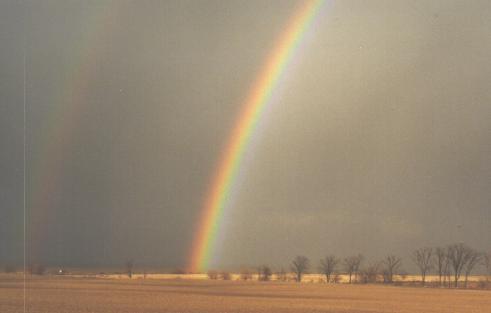
The rainbow is a natural spectrum caused by the refraction and reflection of sunlight through raindrops, and shows that sunlight consists of a continuous run - - a continuum -- of colors from red to violet. Note the fainter outer bow caused by double reflections inside the raindrops. Photo by J. B. Kaler
Extending the light: the electromagnetic spectrum
Stand outdoors to see and feel the radiation pouring from the Sun. Most of the energy of the Universe is transported in this way, by radiation. The visual spectrum of light, however, is but a tiny portion of the whole picture, of a huge spectrum of radiation that extends in both directions from the edges of the rainbow. If with superhuman eyes you could see beyond red, you would encounter the "infrared" -- felt as heat on the skin -- which would merge gradually into the familiar "radio" portion of the spectrum. Shorter than violet you would see the ultraviolet, that which gives us tans and sunburns, and then you would encounter much more dangerous X-ray radiation and finally deadly gamma rays.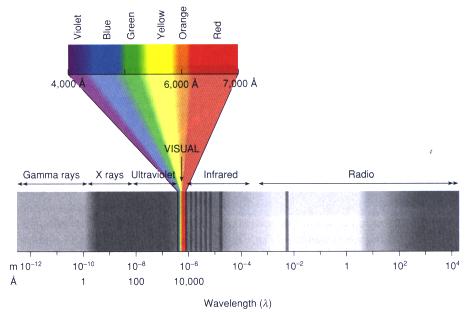
The electromagnetic spectrum runs from short gamma rays at left to long radio waves at right. The narrow visual band, broken into its major colors, is in the middle. From "Astronomy! A Brief Edition," J. B. Kaler, Addison- Wesley, 1997.
Electromagnetic waves
Except for the energy they carry, all portions of the spectrum -- ordinary light, infrared, radio, ultraviolet -- are fundamentally the same. They are unified by thinking of them as "electromagnetic waves," waves of alternating strength in electric and magnetic fields that all move through space at the "speed of light" (called "c") of 300,000 kilometers per second (186,000 miles per second), eight times around the Earth in the tick of a clock. The differing kinds of radiation simply have different wavelengths, that is, the separations between crests in two successive waves. Visual radiation is in the middle, with wavelengths that extend from 0.00004 centimeters for violet light to about 0.00007 centimeters for extreme red. These wavelengths are so short that astronomers use a small unit of distance, the "Angstrom" (A), which is 0.00000001 centimeters long. The violet limit therefore falls at 4000 A and the red limit near 7000 A or a bit longer. Infrared runs from the red limit to about 0.1 millimeter, and the radio to as long as you wish, even to kilometers. Ultraviolet runs from 4000 A down to about 100 A, X- rays take over to about 1 A, and these are followed by the gamma rays to no known lower limit. The named divisions are artificial and serve only to block out large spectral segments.Photons and energy
Though light and its partners can act like waves, at the same time they can act like a stream of particles. In a crude sense, these particles, called "photons," carry the waves. The smaller the wavelength of the photon the more energy it carries, that is, the greater the ability of the photon to act on some physical substance. Long radio waves are generally benign. You can live near a high-powered radio transmitter with no effect on you and are quite unaware of all the radio photons that constantly surround and pass through you. Shorter-wave photons have increasingly potent effects. Infrared is felt as heat, visual radiation excites the chemistry of the eye, ultraviolet burns, and no one wants to stand in front of an active X-ray machine for long. A single gamma ray photon can carry the energy of over a million million million radio photons.Reflection, refraction, and dispersion
Light and its partners can be manipulated in a variety of ways. The most familiar is "reflection," in which light is bounced from a surface, the light coming off at the same angle at which it hits, resulting in your undistorted face looking back at you from a mirror. Radiation travels at "c" only in a vacuum. When it passes into a substance, it slows and can be bent, a common phenomenon called "refraction." The effect is easily seen when looking at something through water. Refraction by a curved lens focuses radiation to create an image. Turned to the sky and attached to a detector, the lens becomes an astronomical telescope. (A curved mirror can create a similar image by reflection.) The speed of an electromagnetic wave in a medium depends on its wavelength. Violet light is slowed in a glass of water significantly more than red light. As a result shorter visual waves refract more than do longer ones. Refracted light is therefore "dispersed" or spread out into its spectrum, creating a rainbow -- or the spectrum of a star. Spectra can also be created by the interference of light waves, the phenomenon that makes the brightly colored patterns seen reflected from a compact audio disc and the halos often observed next to a bright, partly clouded Moon.The Spectrograph
Astronomers produce spectra by means of a "spectrograph" affixed to the telescope. The oldest form of the device was visual (a spectroSCOPE), and consisted of little more than a prism in a tube fixed to the end of the telescope, the refracted light focused by an observer's eyepiece. By the turn of the 20th century, spectra were being recorded photographically. In the middle of the century, prisms were replaced by "diffraction gratings," finely ruled surfaces that produce spectra by the interference of light waves. In the modern spectrograph, light is sent from the telescope onto a "collimator," a curved mirror that straightens the converging beam. The collimator sends the beam to a reflecting grating that makes a spectrum, the colored light then focused by a camera onto a detector, usually a "charge-coupled device," or "CCD," that records the spectra digitally. Spectra are commonly seen reproduced either photographically or graphically.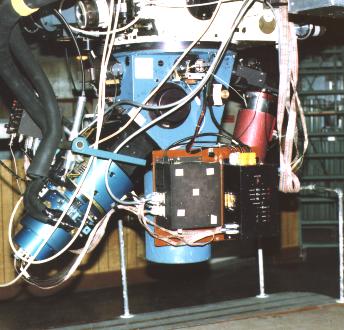
The spectrograph, fitted to the base of the telescope (seen at the top), breaks light into its component colors and records the spectrum. Light from a star goes straight to the collimator at the bottom of the instrument and is reflected back up to a diffraction grating in the middle. It is then reflected down and to the left to a digital detector for storage and display on a video terminal. University of Arizona Steward Observatory spectrograph photo by J. B. Kaler
Atoms and the chemical elements
Electromagnetic energy cannot be separated from matter. Indeed, matter both creates and destroys radiation. All the matter around us is made ultimately of tiny particles, of "atoms" of different kinds. These in turn are made of yet-smaller particles. The atom, in a conceptual sense, can be thought of as consisting of a nucleus made of one or more protons (particles that carry positive electric charges) and neutrons (neutral particles with masses about equal to those of protons). The kind of atom -- or "chemical element" -- whether hydrogen, oxygen, or iron, depends only upon the number of protons in the nucleus (for these, 1, 8, and 26 respectively). The nucleus is surrounded by a cloud of much lighter electrons that carry negative electric charges exactly equal in amount to those carried by the protons. The electrons are bound to the nucleus by the "electromagnetic force," the force responsible for the production of electromagnetic radiation. The protons are bound together even though of the same charge by the much more powerful short-range "strong force," which is carried by both protons and neutrons, but not by the electrons. The neutrons' job is to add strong force to help keep the nucleus together.Ions
A normal atom, with equal numbers of protons and electrons, is electrically neutral. You get no electric shock by touching matter in its normal state. It is easy, however, to remove electrons from an atom and to electrically unbalance it. The result of electron removal is a positively charged "ion." In fact, all the electrons can be removed to reveal a bare nucleus. Hydrogen, with one electron and one proton, has but one ionization "state" (the lone proton). Iron, with 26 electrons has 26 ionization states, each more positively charged than the next as more and more electrons are taken away.Molecules
The electrons of two or more atoms can link together to form chemical bonds that make molecules from the chemical elements. The atoms can be the same or can be different. Common examples of such "chemical compounds" are molecular oxygen (two oxygen atoms locked together), water (two hydrogen atoms coupled with an oxygen atom), and carbon dioxide (two oxygens and a carbon). The molecules have characteristics that are completely different from their component atoms. There is no limit on the number of atoms that can be linked, and as a result there is an infinite number of kinds of molecules, the collection of which gives us all the riches of the natural world, including life.Isotopes
The number of neutrons present in any kind of atomic nucleus is not fixed. All atoms have a set of variants called "isotopes" in which the proton number is the same but the neutron number is different. For example, the most common kind of hydrogen has only one proton. But you can attach a neutron to the proton and still have hydrogen. This heavy form, called "deuterium," is present in nature. About 0.001% of all the water you drink is deuterium oxide instead of normal water, but since the different isotopes of an atom have about the same chemical properties, deuterium has no special effect on you. The great bulk of iron (92%) has 30 neutrons coupled to its 26 protons, but 6% has 28 neutrons, 2% has 31 and a small remainder 32 neutrons. Some elements, like beryllium and scandium, have but one stable (see below) isotope. Tin, with 10, holds the record number.Radioactivity
For any atom there is a limit to the number of neutrons allowed, that is, on the number of different stable isotopes. If there are too many or too few neutrons, the nucleus becomes UNstable and falls apart with the emission of particles (neutrons, helium nuclei, electrons) and high-energy electromagnetic radiation (notably gamma rays). Such "radioactive" isotopes can be quite dangerous. A radioactive isotope decays away at a steady rate defined by its "half-life," the time it takes half of the substance to turn into a lighter product. The shorter the half- life, the more dangerous the isotope. Some radioactive isotopes last for billions of years, others for fractions of a second. Some chemical elements have no stable isotopes at all and are therefore rare. All elements heavier than bismuth (83 protons) are radioactive, the set including familiar radium and uranium. Uranium (92 protons) has a very long half life, and as it decays to lead, it produces the Earth's radium (88) along the way. Most of the helium on Earth is a by-product of such decay. Since the decay rates of different radioactive elements are known from the laboratory, the ratio of the abundance of the parent element (uranium for example) to the daughter product (for uranium, a specific isotope of lead) in a rock gives the rock's age, the time since it solidified. We can therefore date the birth of the Solar System and the Sun to 4.5 billion years ago from the ages of the oldest rocks (meteorites and rocks from the Moon).Radiation by matter
Normal non-radioactive matter can radiate too, not by nuclear decay, but as a result of the heat it contains. The kind of radiation emitted depends on temperature. If you turn on your toaster in the dark, you can see it glow, the visual spectrum radiated by the hot metal. The hotter the toaster's radiating element, the higher the energy of the radiation it can emit. At low temperatures you see only red, but if you could increase the temperature high enough, the toaster would emit blue and then violet light as well as red. At a million degrees Kelvin (centigrade degrees above absolute zero, -273 degrees C) it would even emit gamma rays (and really burn the toast). At very low temperatures it will still radiate. At a few hundred degrees, the temperature of the kitchen, it radiates infrared. Even in the cold of interstellar space, the toaster would produce radio photons (space toast?). As a general rule, as temperature goes up, a body produces ever more radiation at all wavelengths shortward of a limit that pushes ever further toward shorter wavelengths. (A cold body radiates radio, a warmer one infrared and radio, warmer yet visual, infrared, and radio, and so on, all kinds present increasing in amount with increasing temperature.) A gas under high pressure will radiate as well as a hot solid. Star colors thus reflect temperature, reddish stars cool (3000 to 4000 degrees Kelvin), bluish ones hot (over 20,000 degrees Kelvin). As a result, we can determine the temperature of a star from its color, more specifically from the details about how the radiation is distributed throughout its spectrum.Absorption "lines"
Now go to the heart of the matter, to how free-flying radiation interacts with atoms to give us detailed information about stars and other celestial bodies. Send radiation from a hot, incandescent solid through a gas of low density and watch what happens. The electrons that surround an atom have a minimum energy below which they cannot go (a discovery of "quantum mechanics" made in the early part of the 20th century). The electrons will naturally seek this lowest energy level. If you move the electrons outward, away from the nucleus, you give them more energy. However, electrons are very specific about what energies they will take. For any given atom or ion, only certain specific electron energies, that is, specific energy levels, are allowed. Electrons can be moved from one energy level to another by collisions among atoms or by absorption of photons. However, an electron in a specific level cannot absorb part of a photon, but must absorb all or none of it. As a result, only photons with particular energies, those that correspond to differences between the various energy levels, can be absorbed from the flow of passing radiation. Since photon energy corresponds to wavelength, only specific wavelengths (or colors) can be absorbed. And since the electron structures are different for each kind of atom or ion, the photon energies that each kind will absorb are also different. When we look at the spectrum from the hot source after it has gone through the low- density gas, we therefore see narrow gaps at particular wavelengths where the light is diminished or even gone altogether. Because of the way they appear, these gaps are called "absorption lines." Each atom or ion has a unique set of absorption lines. Hydrogen has only four in the visual spectrum: at wavelengths of 6563 A in the red (called H-alpha), at 4861 A in the blue (H-beta), and at 4340 A (H-gamma) and 4101 A (H- delta) in the violet), whereas iron has thousands.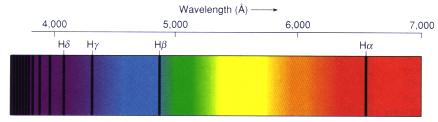
Dark hydrogen absorption lines appear against a continuous visual spectrum, the light in the spectrum absorbed by intervening hydrogen atoms. From "Astronomy! A Brief Edition," J. B. Kaler, Addison-Wesley, 1997.
Absorption lines in stellar spectra
The deeper you go into a star, the hotter and denser the gas. The lower layers tend to radiate all the colors rather like a hot solid, while the upper layers act something like the low density gas of the last paragraph through which the radiation passes. Stars are made of the same stuff as found in the Earth (though not in the same proportions), and contain all of nature's chemical elements. As a result, the spectrum of a star displays an extraordinary mixture of absorption lines. Over 100,000 absorption lines are visible in the Sun's spectrum.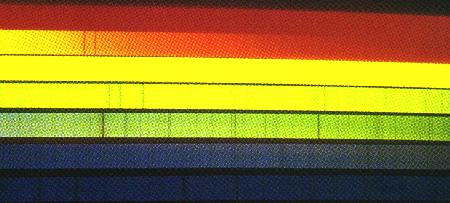
The solar spectrum is filled with absorption lines at particular colors or wavelengths, each dark line associated with a particular atom or ion. The pair in the orange, for example, are made by neutral sodium, the trio in the yellow by magnesium. Kitt Peak National Observatory.
Analysis of absorption lines
The absorption lines in the Sun and stars can be identified with individual chemical elements or molecular compounds by comparing their positions in the spectrum (their wavelengths) with those observed from pure sources in the laboratory. Some absorptions are very weak, just shallow dips in the spectrum, whereas others are completely black. The "strength" of an absorption line -- the amount of energy removed from the spectrum -- depends on the amount of the particular chemical element in the star causing the line and on the efficiency of absorption. The efficiency is crucial. Hydrogen dominates the Sun, yet absorption lines of ionized calcium dominate the solar spectrum even though there is 440,000 times as much hydrogen as calcium. Hydrogen has a low efficiency of absorption, whereas that of ionized calcium is very high. The efficiency depends on the availability of electrons to move to higher energies and on atomic factors, namely the likelihood of absorption in the presence of a passing photon. The efficiencies depend critically on temperature and can be calculated from theory or measured in the laboratory. Once they are known, we can calculate the abundances of the atoms from the strengths of the absorption lines and therefore calculate the chemical composition of the outer part of a star. Relative absorption line strengths can also be used to find temperatures and densities.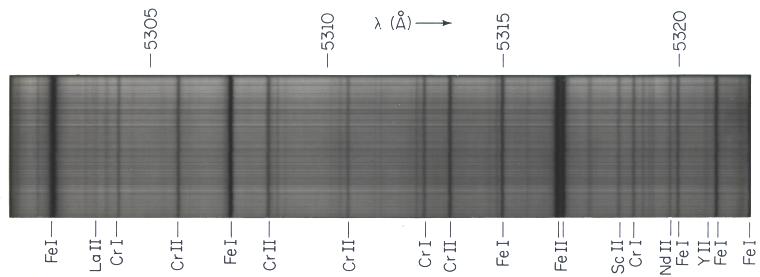
The Sun displays an enormous number of spectrum lines, over three dozen appearing here in a 20 A-wide stretch in the yellow part of the spectrum. Roman numeral "I" stands for the neutral ion of an element, "II" for the once- ionized version. Different lines have different strengths. The ionized iron lines are nearly black, whereas those produced by the much rarer elements yttrium (Y), neodymium (Nd), and lanthanum (La) are very weak. E. C. Olson, Mt. Wilson Observatory.
Emission lines
What goes up must come down. Electrons, like anything else, will attempt to seek their lowest energies. If the electrons gain energy by the absorption of photons, or perhaps by collisions, they must eventually lose it again. They can lose it in collisions or they can, instead of absorbing photons, radiate them. Since the absorption wavelengths are tightly defined, so are the emission wavelengths. If we look at a heated low-density gas WITHOUT looking at a bright source behind it, we will see BRIGHT lines of color at the same spectral wavelengths at which we before saw dark absorptions. For any given atom or ion, the emission spectrum is a simple reversal of the absorption spectrum. Emission lines are easy to produce in the laboratory simply by heating a low-density gas, allowing collisions to kick the electrons to higher energies. The emissions are produced when the electrons drop back down to lower energies. Emission lines are radiated by street lamps (the orange ones radiating sodium lines, the blue ones mercury lines), neon signs, and fluorescent bulbs. They are also produced by clouds of interstellar gas ( nebulae) that are heated and ionized by nearby hot stars. Under some circumstances, stars can radiate emission lines too. For example, Mira variables have hydrogen emission lines that are excited by powerful shock waves -- sonic booms -- made by the stars' pulsations.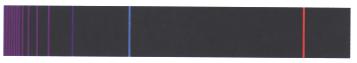
Hydrogen emission lines are radiated by a hot, thin hydrogen gas, and appear at the same wavelengths as the hydrogen absorption lines. From "Astronomy! A Brief Edition," J. B. Kaler, Addison-Wesley, 1997.
Emission Nebulae
Emission nebulae, clouds of interstellar gas that produce emission lines, exist in three main forms: as diffuse nebulae (like the Orion Nebula below), planetary nebulae (like the Ring Nebula in Lyra, also below), and supernova remnants. Diffuse nebulae are the leavings of star formation, clouds of dusty interstellar gas that are ionized by ultraviolet radiation from the massive hot stars near or within them. Planetary nebulae are ejecta of dying stars that are lit by even hotter, nearly-exposed stellar cores that are on their way to becoming white dwarfs. Supernova remnants are a combination of hot ejecta of exploding stars (supernovae) and local interstellar matter heated by shock waves from the explosion.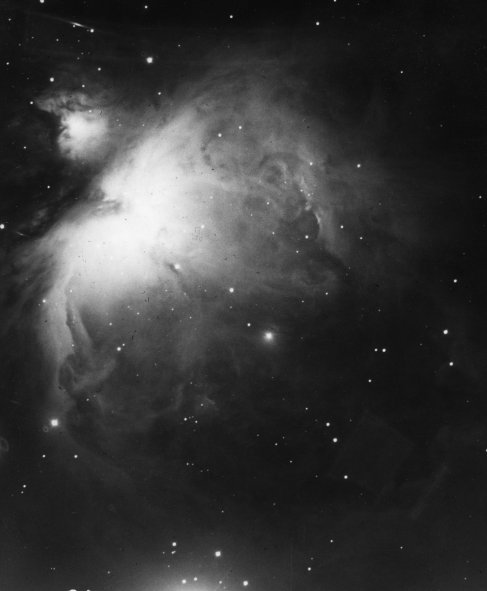 |
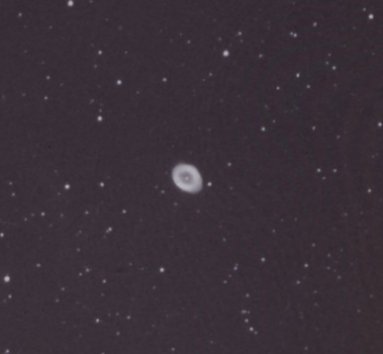 |
The Orion Nebula (left), a great cloud of interstellar gas ionized by hot young stars at its center, and the Ring Nebula (M 57, right) both radiate emission lines, including those of hydrogen seen above and a huge number of others. The ionizing stars of the Orion Nebula (Theta-1 Orionis) are lost in the nebula's bright glow, while the ionizing core of the Ring Nebula is at the Ring's center. University of Illinois Prairie Observatory
Nebular Spectra
Nebular emission lines fall into two basic types: permitted recombination lines and forbidden (collisional) lines. Recombination lines are caused when atoms in a nebula are ionized by absorbing energy from the ultraviolet light radiated by a nearby or embedded hot star. When free electrons are re- captured by various ions, they can land on any energy level. The electrons then skip downward, radiating emission lines as they go. Hydrogen and helium produce only recombination lines, as do atoms and ions of oxygen, nitrogen, carbon, neon, and others. Forbidden lines are not really forbidden, just difficult to produce from energy levels that do not readily interact with each other (making the transitions of electrons between them difficult). They are indicated by square brackets, and are caused when energetic free electrons collide with atoms or ions whose electrons are in the bottom level and excite these bound electrons to higher levels, from which they eventually drop downward to radiate emission lines. Analysis of line strength allows the determination of nebular temperature, density, and chemical composition.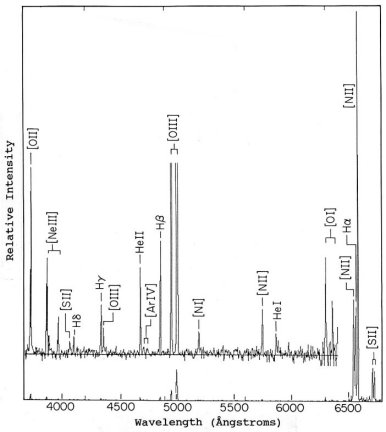
The planetary nebula BV-1 displays a variety of emission lines. The producing ion is indicated by Roman numeral, "I" for neutral, "II" for single ionization (one electron missing), "III" for double ionization (two missing), and so on. The full spectrum is at the bottom. The inset above it shows a vertically expanded view. Hydrogen and helium produce recombination lines. Square brackets indicate collisional (forbidden) lines, which include those of nitrogen, oxygen, neon, argon, and sulphur.
The stellar spectral sequence
Because the efficiencies of absorption depend on temperature, so do the appearances of the spectra of the stars. Stellar spectra were first observed in the middle of the 19th century. To the great confusion of the astronomers of the time, most spectra looked nothing like the solar spectrum. Some, like that of Vega, had powerful hydrogen lines, whereas others had none at all and displayed what were later shown to be molecular lines of titanium oxide. It looked as though different stars were made of different elements. As an aid to understanding, astronomers began classifying the spectra, the schemes culminating about 1890 in the one still used today when E.C. Pickering lettered the stars according to the strengths of their hydrogen lines, his assistants Annie Cannon, Antonia Maury, and Williamina Fleming aiding in development and observation. As observation improved, they dropped some letters, rearranged others according to different spectral criteria, and added decimalization. The result was the classic seven-group sequence OBAFGKM. A bit over a century later, as a result of new technologies, astronomers added another two classes whose spectra contained molecules, L and T. About the first thing any astronomer wants to know about a star is its class. The Sun is class G.Characteristics of the spectral classes
In the modern spectral sequence, OBAFGKMLT, the hydrogen absorption lines weaken in both directions away from class A. Various other absorptions round out the picture. It was noted very early that the spectral sequence in this form correlates with color, ranging from a blue tint for O and B stars to reddish for class M. Since color depends on surface temperature, so must the spectral class. Stars of class T and cool L radiate only in the infrared and are invisible to the eye. Class T contains only brown dwarfs, while class L (and even cool M) is a mixture of brown dwarfs and true dwarfs that run full hydrogen fusion. (The temperatures in the table below are for main sequence dwarfs.)| Class | Spectrum | Color | Temperature |
|---|---|---|---|
| O | ionized and neutral helium, weakened hydrogen | bluish | 31,500-49,000 K |
| B | neutral helium, stronger hydrogen | blue-white | 10,000-31,500 K |
| A | strong hydrogen, ionized metals | white | 7500-10,000 K |
| F | weaker hydrogen, ionized metals | yellowish white | 6000-7500 K |
| G | still weaker hydrogen, ionized and neutral metals | yellowish | 5300-6000 K |
| K | weak hydrogen, neutral metals | orange | 3800-5300 K |
| M | little or no hydrogen, neutral metals, molecules | reddish | 2100-3800 K |
| L | no hydrogen, metallic hydrides, alkalai metals | red-infrared | 1200-2100 K |
| T | methane bands | infrared | under 1200 K |
The visual colors are actually subtle and as much reflect where most of the light lies in the spectrum as the color a person would actually view. Classes A through G all look rather white to the eye. Decimal subdivisions of the spectral classes go toward lower temperature, for example, A0 lies at the hot end of class A near a temperature of 10,000 K, while A9 is at the cool end near 7200 K. The Sun, with a temperature of 5800 K, is class G2. The above temperatures are for main sequence dwarfs. Those of other luminosities may differ, especially in classes G and K, where the temperatures of giants are a up to a few hundred degrees lower and those for supergiants are lower yet.
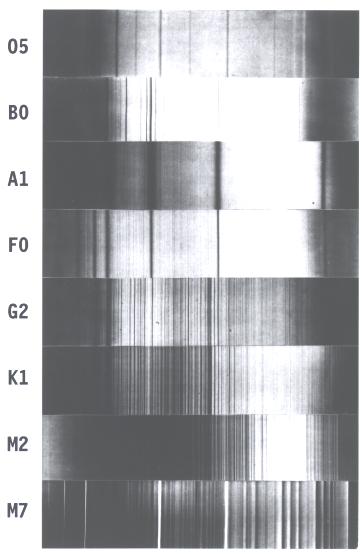
The classic spectral sequence is illustrated by the spectra of real stars in a historic image published in 1901. The strong lines in class A (here, the star Sirius) are hydrogen. Neutral helium appears along with hydrogen in class B (Alnilam, Epsilon Orionis), while ionized helium is strong in class O (Naos, Zeta Puppis), the hydrogen lines nearly gone. Hydrogen weakens downward too, toward lower temperature, nearly disappearing by class M2 (Betelgeuse). The strong lines to the left in classes F (Canopus), G (Capella), and K (Arcturus) are those of ionized calcium. The other lines in these cooler classes are those of other metals. At the bottom, in class M7 (the long-period variable star Mira), we see bands of absorption produced by the titanium oxide molecule. Annals of the Harvard College Observatory, vol. 23, 1901.
The interpretation of the spectral sequence
Analyses of the spectra show that all the stars of the main sequence, those fusing hydrogen in their cores, have similar chemical compositions, all about 90% hydrogen, 10% helium, and 0.1% everything else (by number of atoms). The 0.1% remainder has a distribution among the elements that is quite similar that found in the Earth and Sun. The differences in stellar spectra, at least for main sequence stars, are caused almost entirely by differences in ionization (after all, if sodium is all ionized, the absorptions of neutral sodium will not be present) and the by the way in which the absorption efficiencies change with temperature.Classifying stars
Classifying stars is something of an art form that comes with practice. Each spectral class is defined by the spectrum of a standard star against which the other stars are compared. The classifier eventually memorizes the standards and can classify the spectrum of a random star very quickly. Annie Cannon classified well over 300,000 stars in her lifetime, one at a time. Modern classifiers are now heading toward automated systems that use computers and complex software to simulate what a human eye and mind can do.Luminosity classes: two-dimensional classification
Although temperature reigns supreme in defining the spectrum of a star, the density of the gas in the region where the absorption lines are formed plays a role too. Giant and supergiant stars are so large that the densities in their outer regions are low, which subtly changes the appearance of the stellar spectrum. For example, the hydrogen lines are quite broad in main sequence (dwarf) stars as a result of the disturbance of the hydrogen atoms caused by collisions. In the huge distended supergiants, however, lower density leads to lowered collision rates, and as a result the hydrogen lines are narrow. In K-type giants, the dark bands of the CN (cyanogen) molecule are stronger than they are in class K main sequence stars. Each spectral class in fact has its own set of criteria. As a result, once we know what these criteria are, we can tell if a star is a giant, supergiant, or of any other category, from its spectrum alone. Roman numerals are used to indicate size and luminosity, "I" for supergiants, "II" for bright giants, "III" for giants, "IV" for "subgiants" (stars that are developing into giants), and "V" for the main sequence. The result is the "MKK class" of the star, named after the 1940s developers of this system, W. W. Morgan, P. C. Keenan, and E. Kellman. Vega is an A0 V star, Polaris is F7 I or II, and Aldebaran is K5 III. The Sun is a G2 V star. White dwarfs are just called "white dwarfs," or "D." All these classes are arrayed on a plot of luminosity (as expressed through absolute visual magnitude) vs. spectral class called the Hertzsprung- Russell Diagram.Only the main sequence runs through all the spectral classes, OBAFGKMLT. With one known exception (the odd variable supergiant V 838 Monocerotis) there are no giants, subgiants, or supergiants of classes L and T, both of which contain only low mass dwarfs and brown dwarfs that are insufficiently massive (below 0.075 solar mass) and too cool inside to run full hydrogen fusion. Class L is a mixture of real dwarfs and brown dwarfs, while class T consists entirely of brown dwarfs.
Distances from spectra
The apparent visual magnitude of a star in the sky depends on the star's actual luminosity and its on its distance. If we know the distance from parallax or from some other means, we can calculate the absolute magnitude. Such calculations have allowed us to learn the absolute magnitudes of all types of stars and to construct the HR diagram. We now work backwards. From the spectrum we determine the class of a star and thus know its absolute magnitude. We can even discriminate within a class, for example brighter giants as opposed to lesser ones. Comparison with the observed apparent magnitude then yields distance. Such "spectroscopic distances" allow us to work our way across the Universe, as our ability to measure parallaxes are limited to stars only within a thousand or so light years.Chemical classes
Main sequence stars have similar chemical compositions. But once a star begins to die and evolve, the rules can change. Newly-minted atoms made by nuclear reactions deep within a star can rise to the surface and change the star's apparent chemical composition, and as a result, its spectrum. The most famous examples are the carbon stars, which display bands of carbon molecules. Almost all are giants. They were originally called class "N" in the old Pickering system. N stars have roughly the same low temperatures as the class M giants, if not a bit lower. Class R, consisting of warmer carbon stars (more like class G and K), was added later. R and N are now lumped together under class "C" for "carbon." Class "S" is used for stars that have intermediate carbon abundances wherein the carbon content is roughly equal to that of oxygen. Their spectra have strong bands of zirconium oxide rather than the titanium oxide of oxygen-rich class M giants. The exception to the "giant-star rule" is a rare class of main-sequence carbon stars that have been contaminated by evolving companions. Other variations in chemical composition can be indicated by adding a letter to the spectral class, for example "Ba" for the strong barium lines that denote barium stars.Subdwarfs
The term "dwarf" is used in stellar astronomy in a variety of ways. Main sequence stars are commonly called "dwarfs." "White dwarfs," on the other hand, are a sequence of dead stars that have lost their outer envelopes and consist of little more than spent, old nuclear-fusing cores. There is also a set of stars that are similar to ordinary dwarfs except that compared to ordinary dwarfs they are somewhat too dim for their temperatures (or too hot for their luminosities, depending on how you look at them). They are therefore called "subdwarfs." On the HR diagram they run just to the left of the main sequence from about class G on down toward cooler stars. Like ordinary main sequence dwarfs, subdwarfs run off the energy generated by nuclear fusion, specifically the fusion of hydrogen into helium. Their distinctiveness is caused by a severe underabundance of metal atoms. A lower metal abundance makes the gases more transparent, which changes the stars' structures and the quality of the radiation they emit. Typically, subdwarfs contain only about a hundredth the iron of the Sun (relative to hydrogen), but at their most extreme the iron abundance (along with the abundances of other heavy elements) drops to only a ten-thousandth solar. Subdwarfs evolve into giants and white dwarfs just as do ordinary dwarfs.Age and the Galaxy
As stars of the Galaxy age, they dump the by-products of nuclear fusion into the interstellar gases through their winds or supernova explosions. New stars are then made from gases that have been enriched in chemical elements from prior stellar evolution. As a result, younger stars contain more of the leavings of older stars, and therefore contain more heavy atoms, including the metals. Because of their low metal content, subdwarfs must be among the oldest known stars. With a relatively high metal content, the Sun, 4.5 billion years old, is relatively young. Most of the stars of our Galaxy are distributed in a great disk almost 100,000 light years across. The subdwarfs and their kind are part of a huge, rather spherical halo that encompasses the disk, showing that the halo was the first part of the Galaxy to form. Subdwarfs are therefore all very old. From the lifetimes of the oldest stars, we calculate that the Galaxy dates back to about 15 billion years ago.Velocities and the Doppler effect
All stars orbit the Galaxy on slightly (sometimes greatly) different paths, and therefore must move relative to each other. Could you watch a constellation for millions of years, you would see the stars slowly changing positions, the motions destroying the figure and helping create new ones. Stars also move along the line of sight, some going away from us, some coming toward us. If a star moves toward us, its light waves seem to come more frequently and the wavelengths seem shortened; if the star is moving away from us, we see the reverse, the wavelengths seeming to be longer. The Doppler effect is easily seen in water waves and heard in sound waves, the latter affecting the pitch of a passing car or airplane, which is higher when approaching, lower when receeding. The degree of shift depends on the speed along the line sight (the radial velocity) compared to the speed of the wave. If the speed were high enough, a good fraction the speed of light, a star would actually change color, seeming too blue if coming at us, too red if going away. Stellar speeds, however, are generally at most only a few tens of kilometers per second, far less than the speed of light, so color changes are not at all visible directly to the eye. (The exceptions are galaxies with large spectral redshifts.) However, the Doppler effect also causes changes in the wavelengths of spectrum lines that ARE readily detectable. At the modern limit, astronomers can measure shifts produced by line-of-sight motions that are as small as a few meters per second, less than the speed of a good runner. Combining data on velocities along the line of sight with those determined across the line of sight (from a star's angular shift and distance) allows us to find the star's actual speed relative to the Sun and to construct a picture of the internal motions in the Galaxy. Doppler shifts are also seen in nebular spectra, where they can be used to assess both velocities and expansion rates. They are crucial in the detections of planets, whose gravities can cause the parent stars to move slightly back and forth along the line of sight, from which we can derive orbtial sizes and lower limits to planetary masses.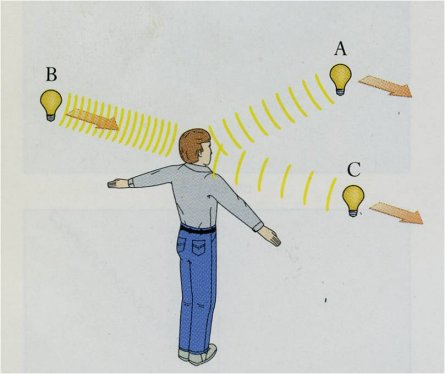
As a source of waves approaches the observer, the wavelengths seem shortened in proportion to the wave velocity; when the source recedes, they are proportionately lengthened. It matters not whether it is the source or the observer that is moving; what counts is relative motion along the line of sight. The Doppler effect is greatly exaggerated here. It's most commonly encountered with much slower sound waves. In stars and nebulae the effect is measured through shifts in the wavelengths of absorption or emission lines. From "Stars," J. B. Kaler, Scientific American Library, New York, Freeman, 1992, copyright © J. B. Kaler.
Spectroscopic double stars
A great many stars are readily seen through the telescope to be double. However, if the stars are too close together, the observer will see them as one, the two images forever blurred together. We can still separate them by means of the spectrum. If the stars of a double are of comparable brightness, the spectrum will be the composite of the two. Unless we are looking directly down the orbital axis (the orbit perpendicular to the line of sight), as the pair orbit each other, the two alternately move toward and then away from the observer. As a result, the spectrum of each star is Doppler shifted first one way and then the other. As one spectrum is shifted to the blue (to shorter wavelengths), the other is shifted to the red (to longer), and vice versa. From the doubled lines that shift back and forth, we know that there are two stars in the system. From the degree of shift, we can derive the back-and-forth speeds of the stars. Since the orbit is most likely tilted to the line of sight, these observed speeds are lower limits to the true orbital velocities, from which we can find lower limits to the stars' masses through gravitational theory. If the star is an eclipsing double, then from the light curve (the graph of magnitude against time) we can find the orbit's tilt and thus derive actual masses.Single-line double stars
If the components of a very close double star system are very different in brightness, then only one set of absorption lines will be seen. We will still see the one set shift back and forth as the stars orbit, however, and can still tell that the star is double. Such "single-line" stars (so-called because there is only one SET of lines, that is, the observed lines are not doubled) provide limited information on masses, but if we can estimate the mass of the star we see from its nature and brightness, then we can derive a lower limit to the mass of the invisible companion.Interacting double stars
Two stars of a very close double can exchange matter through tides, the mass usually flowing from the larger star to the smaller one. Such flowing gas has a low density and radiates emission lines that are superimposed on the spectrum of the double and give away the fact that the stars are interacting. From the kinds and natures of the emission lines and from their Doppler shifts we can learn the rates, masses, and the speeds of the flows to build up a picture of how the interactions actually take place.Planet discovery
The "single-line" concept has a powerful application in the discovery of planets orbiting other stars. In a double star system, each star affects the other and each revolves around a common center of mass. Each star therefore moves back and forth along the line of sight. Even an orbiting planet will make its star shift back and forth by a small amount. The Sun moves at a speed of about three meters per second as a result of Jupiter's pull. The amount by which a planet will shift a star's spectrum is easily within the range of modern measurement. From such subtle reflexive motions, we infer the masses of tiny bodies, of planets. Hundreds have been found with masses that range from those of brown dwarfs down to roughly comparable to that of Earth. Planets are also found if they transit in front of their stars, causing dips in brightness. If the planets are detected by both techniques, we can find planetary masses, radii, and densities. Transits also potentially allow the spectra of the planetary atmospheres to be examined.To know the stars
In examining spectra, we have moved from the very small, from little waves and atoms, to the very large, to stars, and then down in scale to planets. But our Sun and planetary system came from "out there," among the stars. To know ourselves, therefore, we must understand the stars and their natures. But the only way of actually understanding them is to understand and appreciate their spectra, the colored rainbows that lead us into their depths. Without spectra, little of stellar natures would be understood and we would still be looking at the sky in ignorance instead of with the modern wonder of discovery.
|