THE HERTZSPRUNG-RUSSELL (HR) DIAGRAM
The stellar astronomer's greatest tool is the HR diagram
and its variants. The classical HR diagram, first constructed in
1914 by Henry Norris Russell (to which was added the work of
Ejnar Hertzsprung), is a plot of absolute visual magnitude
against spectral class. The natures of nearly all the myriad
kinds of stars are beautifully expressed within its confines.
With the application of theory, the HR diagram tells us how stars
age and how one kind transforms itself into another.
This page is divided into two sections. The first presents a
modern classical HR diagram and its description. In the second,
the HR diagram is overlaid with the locations of variable stars whose natures are summarized in
the table that follows.
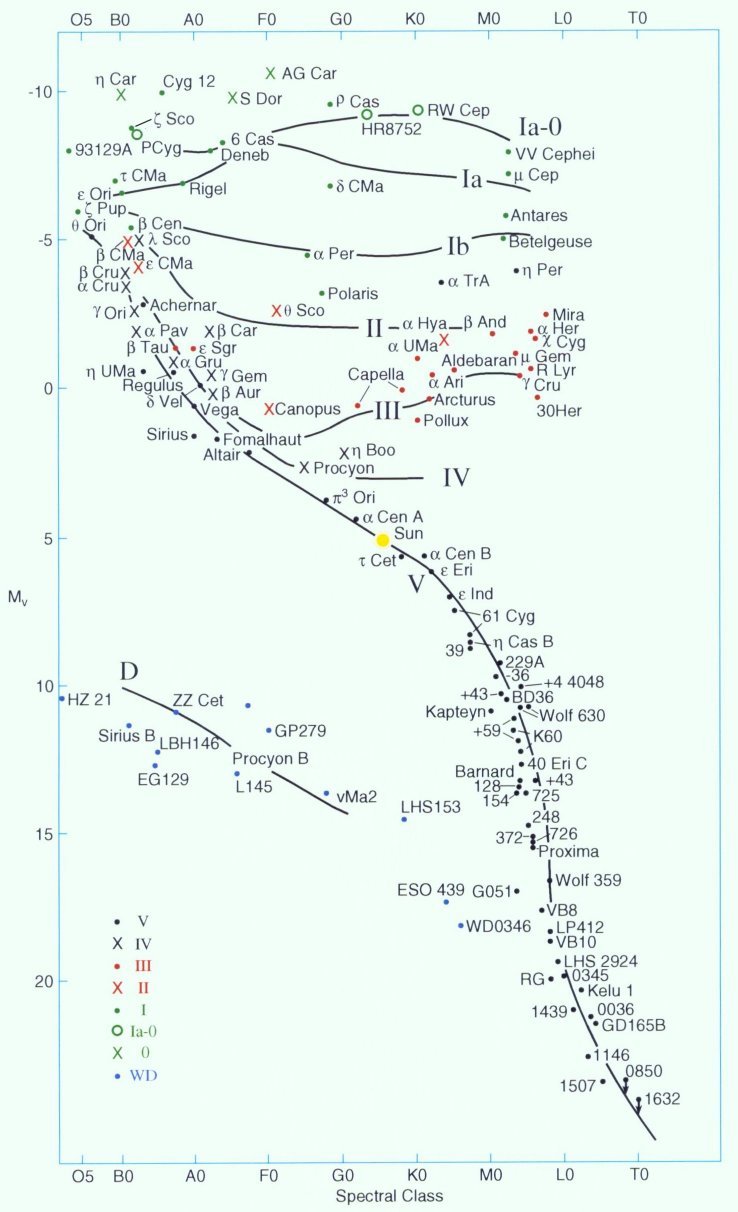
In this classical HR diagram, a wide sample of well-known stars
is graphed according to absolute visual magnitude
on the vertical axis and spectral
class OBAFGKMLT on the horizontal axis. Each star is
identified by name, or an abbreviation thereof. Most of the
brighter ones have descriptive essays in STARS. Each magnitude division
represents a factor of 2.5 in brightness. At absolute
magnitude -10, stars are visually about a million times more
luminous than the Sun, whereas at +20 they are about a million
times fainter. The first seven letters of the spectral sequence
belong to the original Harvard Sequence of 1901. Cool, red (and
infrared) L and T were added in 1999. The sequence is a temperature scale that runs from
about 45,000 Kelvin among the hot O stars at the left end to
below 1200 K among the class T stars at the right end. Class T
stars cannot be plotted since they are so cool that they can be
observed only in the red infrared portions of the spectrum, and
therefore have no visual magnitudes.
The mean positions of the different MKK (Morgan-Keenan-Kellman)
luminosity classes, hence evolutionary states, are shown by
solid lines labelled by Roman numerals (to which are added a
class "0" for hypergiants and "D" for white dwarfs).
The locus of the true hypergiants (class 0, "zero") runs across
the very top. That of the low-metal subdwarfs (not shown) runs just
to the left of the standard dwarf sequence from about class G on
down. Half the stars of class L and all those of class T are brown dwarfs. The luminosity
class of each star is coded according to the symbols in the
legend in the diagram at far lower left (where "WD" refers to
"white dwarf").
Variations on the HR Diagram theme include plots of true
luminosity in watts vs. temperature, and various kinds of
magnitudes plotted against color.
Explanation and Evolution
Main sequence dwarfs from mid-L or so up through class O all
quietly fuse hydrogen into helium in their cores. The highest
masses, around 120 times that of the Sun, are at the upper left,
while the lowest masses are at lower right. Class L and T brown
dwarfs, with masses under about 0.075 times that of the Sun, are
too cool inside to run full fusion starting with ordinary
hydrogen, and can fuse only their natural deuterium (heavy
hydrogen).
When the core hydrogen runs out, main sequence stars balloon
outward to become (depending on their masses) giants or
supergiants. The lower a star's birth mass, the longer it will
live. At the high mass end, hydrogen-fusing lifetimes are as
short as two million years. At a mass of around 0.08 solar
masses, lifetimes hit the 12-13 billion year age of the Galaxy. No star below this
limit has ever died.
Stars below about 10 solar masses expand and cool to become first
subgiants and then true giants that fuse their core
helium into carbon and oxygen (the cores surrounded by
hydrogen-fusing shells). The coolest giants at far right have
used all their central helium and are expanding again with dead
carbon-oxygen cores (surrounded by nested shells that fuse helium
and hydrogen and that alternate in their burning cycles). The advanced giants then lose
their quiet outer envelopes through powerful winds to expose
their cores, which become white dwarfs. The cooling
time for white dwarfs is so long that none has ever disappeared
from view in the history of the Galaxy. There are no "black
dwarfs."
When high mass dwarfs, those above about 10 solar masses, deplete
their hydrogen cores, they expand and cool as supergiants. White dwarfs
must be under 1.4 solar masses (the Chandrasekhar Limit) to
support themselves; otherwise they collapse. A supergiant is so
massive that its core would exceed the Limit. Moreover, its high
mass allows its carbon and oxygen to fuse to heavier elements and
then to iron. The catastrophic collapse of the iron core causes
the rest of the star to explode as a brilliant supernova that typically
hits absolute magnitude -17.
Not Shown
- Central stars of planetary
nebulae. Planetary nebulae are complex shells of
illuminated gas that surround dying stars. The shells are the
compressed, expanding remnants of advanced giant star winds,
while the central stars are in the process of becoming white
dwarfs. They fall to the left of the upper-left quadrant of the
above HR diagram.
- Neutron
stars. Neutron stars (exemplified by X Persei) are the collapsed cores of
supergiants that have exploded as supernovae. They are about 20
kilometers across with average densities of a million tons per
cubic centimeter. With temperatures of the order of a million
degrees Kelvin, they would fall far off to the left of the
diagram.
- Black holes.
Black holes, which may be created out of supernovae from the most
massive stars, emit no light on their own and cannot be seen.
Their surroundings may become visible if they accrete mass from a
binary companion, but they
still cannot be placed on an HR diagram. The best known is in
the Cygnus X-1 system.
The components of widely-spaced double (or multiple) stars evolve
in the same way. However, if the members are close together,
they can transfer matter back and forth (through tides) and
strongly influence each others' development (the classic example
Algol, Beta Persei). Transfer of enough
mass from a normal star onto a white dwarf companion can cause
the latter to exceed the Chandrasekhar Limit of 1.4 solar masses
and to explode as another kind of supernova. These "Type Ia"
supernovae (the core collapse kind called "Type II") can hit
absolute magnitude -19 and are invaluable to the study of the
distances of galaxies and of the expanding Universe.
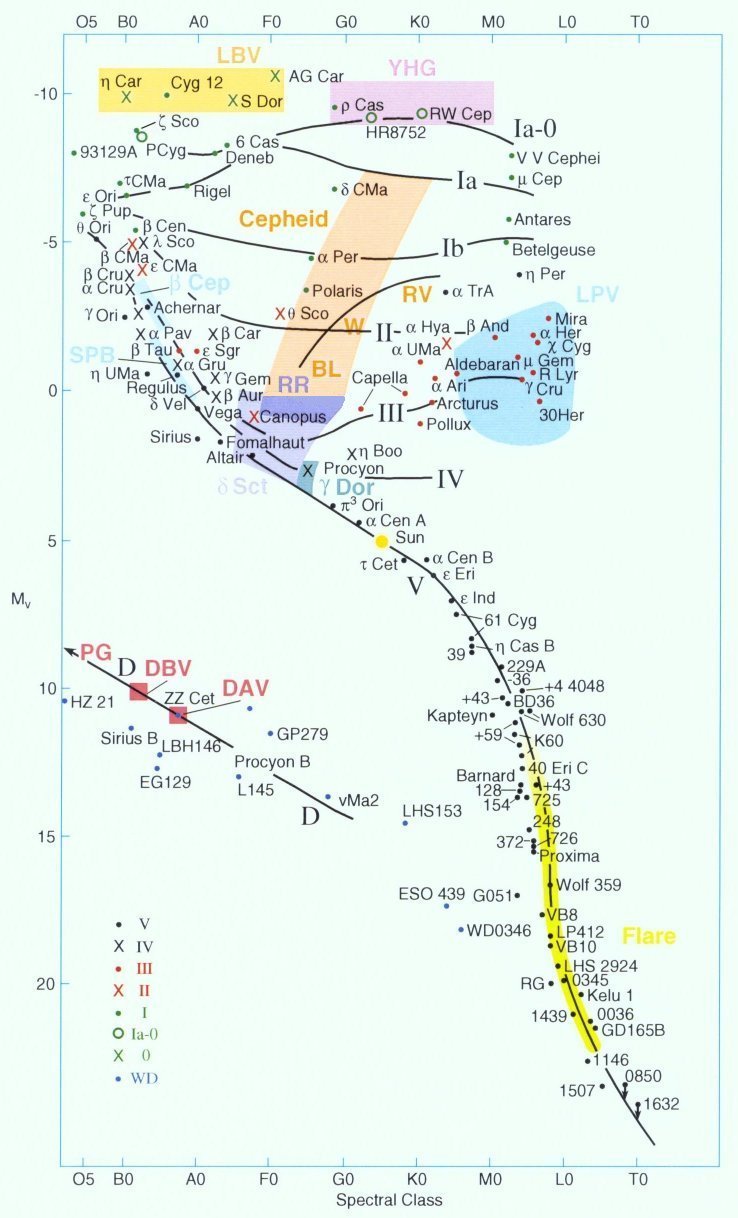
While most of the main sequence is stable, many other regions of
the HR diagram (including a section of the main sequence itself)
are not. As a result, stars can vary in brightness in a
remarkable variety of ways, some pulsating, others erupting or
flaring. Variables give great insight into processes that take
place within stars. Different kinds of variable stars are
denoted by labelled colored patches, which are named and
described in the following list, going more or less from high
luminosity to low.
- LBV: Luminous Blue Variables. LBVs exhibit three to four
magnitude variations over periods of years, even decades, and are
subject to huge eruptive outbursts. Such stars, like Eta Carinae and P
Cygni, are very rare.
- YHG: Yellow Hypergiants, semi-regular variables subject to
huge dips as a result of dusty outbursts. They are related to
LBVs. A classic example is Rho Cas.
- Cepheid: Pulsating
high mass bright giants and supergiants that vary by a magnitude
or more over periods from 1 to 100 days. The collective band
that runs from the Cepheids down through the Delta Scuti stars is
called the Cepheid instability strip. Subtypes within the
strip are:
- Classical Cepheids (orange-yellow band) include Delta Cephei, Zeta Gem, and Eta
Aql. Their absolute visual magnitudes are closely tied to
their pulsation periods, allowing them to serve as prime distance
indicators.
- BL, W, RV: Respectively BL Herculis, W Virginis, RV
Tauri stars. Sometimes called "Population II Cepheids," they are
lower metal, lower mass versions of classical Cepheids with
respectively short, intermediate, and longer periods that range
to 100 days.
- RR: RR Lyrae stars, low mass pulsating stars with
helium-fusing cores. They have variation amplitudes of a few
tenths of a magnitude and periods under a day. Their uniform
absolute magnitudes make them good distance indicators.
- Delta Sct: Delta Scuti
stars, class A dwarfs, subgiants, giants, with variations of a
few hundredths to tenths of a magnitude and multiple periods
under a day.
- Gamma Dor: Gamma Doradus
stars, class F versions of the above, but with longer periods and
a somewhat different pulsation mechanism.
- Beta Cep: Beta Cephei Stars. Class
B giants and subgiants that vary by a few percent with multiple
periods usually under a day.
- SPB: Slowly Pulsating B stars, also known as 53 Persei stars. SPBs are lower
luminosity/temperature versions of the above.
- LPV: Long Period Variables, otherwise known as Mira variables. These remarkable stars have
five to ten magnitude variations over periods of 100-600 days.
All are brightening red giants with dead carbon-oxygen cores.
Stars with shorter periods and lower amplitudes are generally
referred to as "semi-regular variables." Some are also classed
as carbon stars.
- DAV: White dwarf variables with pure hydrogen outer layers.
Also called ZZ Ceti stars, they lie on the extended instability
strip and vary by a few tenths of a magnitude over periods of
minutes. Temperatures range from 10,500 to 13,000 Kelvin.
- DB: White dwarf variables with pure helium outer layers.
They are higher temperature (20,000 Kelvin) versions of the
above.
- PG: PG 1159 stars. Very hot (130,000 Kelvin) versions of
above two. They are related to the central stars of planetary nebulae.
- Flare: Flare stars. These are mostly class M red dwarfs,
though K and L dwarfs can flare too. They exhibit sudden
brightening across the spectrum as a result of
reconnection/collapse of magnetic fields similar to (but more
violent than) those that take place on the Sun. The best known
is Proxima Centauri.
The stories of individual variables can be found at Stars Arranged by Spectral Class
or at its Greek Letter
Version
 Except as otherwise noted, copyright © James B. Kaler.
All rights reserved. These contents are the property of the
author and may not be reproduced in whole or in part without the
author's express consent except in fair use for educational
purposes. HR diagrams copyright © Cambridge University
Press. Any reuse must request permission from the Press.
Thanks to reader number
Except as otherwise noted, copyright © James B. Kaler.
All rights reserved. These contents are the property of the
author and may not be reproduced in whole or in part without the
author's express consent except in fair use for educational
purposes. HR diagrams copyright © Cambridge University
Press. Any reuse must request permission from the Press.
Thanks to reader number  . .
|