 |
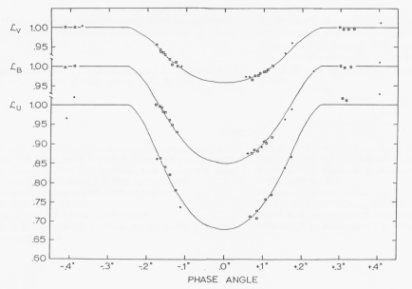
The graph shows the two-day partial eclipse that took place on January 15, 1989, of Tau Per B (the A dwarf) by Tau Per A (the G giant) at visual (yellow) wavelengths (top), in blue light (middle), and in the ultraviolet (bottom). Luminosity is plotted against the angle the stars make with each other. Since the A dwarf radiates more strongly at shorter wavelengths, the eclipse is deeper in the blue and ultraviolet than it is in the visual wavelength band. The continuous U-shaped curves show that the eclipse is partial, that is, that the dwarf is not completely hidden behind the giant. From D. S. Hall and 20 other authors in the Astronomical Journal, vol. 101, p. 1821, 1991. |