 |
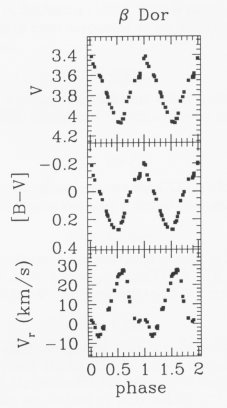
The top graph shows the visual (V) light curve of Beta Doradus over two cycles, where "phase" is the relative period, which begins with maximum light at 0 and ends with maximum light at 1. The middle graph gives the relative change in "color," the blue magnitude (B) minus the usual visual magnitude (V). Color correlates with temperature and spectral class, wherein the more positive values indicate cooler temperature. (These are not true B-V colors, but show only relative change.) The bottom graph shows the "radial velocity" of the star, that is, how fast the star appears to be moving along the line of sight as determined from the Doppler shift (positive values indicating recession). The variation is coming from the expansion and contraction of the stellar surface during the pulsation cycle. The star is brightest not when it is biggest or smallest, but when it expanding the fastest, and dimmest when it is contracting the fastest. From an article by D. Bersier in the Astrophysical Journal Supplement Series, vol. 140, p. 465, 2002. |